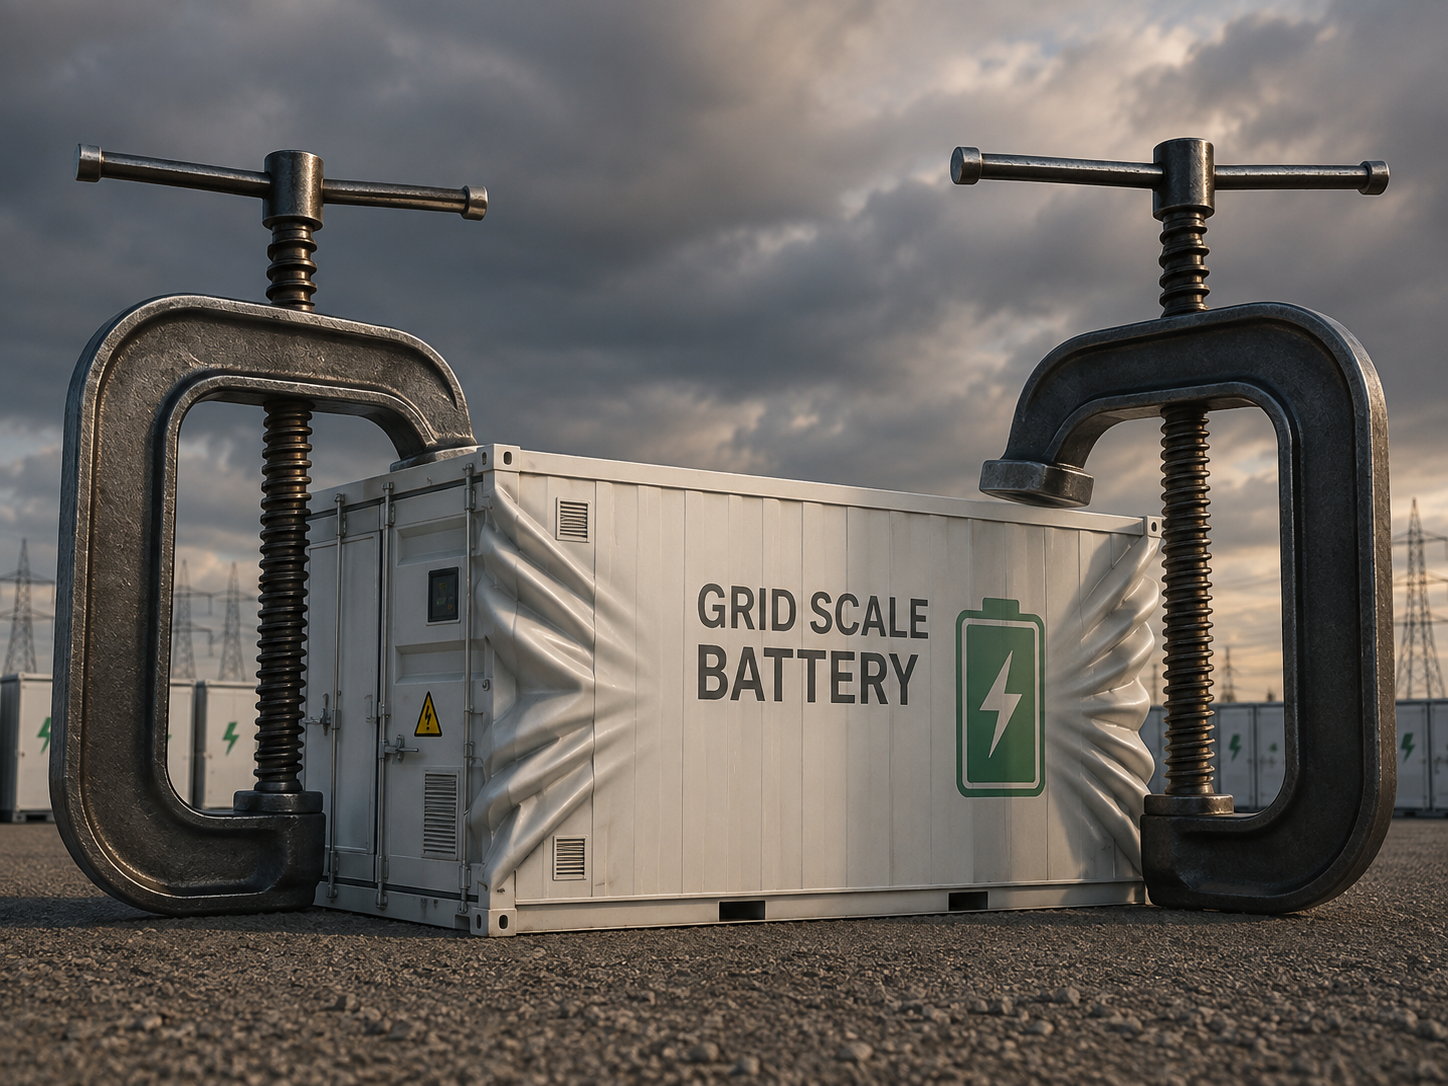
Australia’s grid-scale battery fleet is being celebrated as a genuine success story, and on the surface it is. Installed battery capacity in the National Electricity Market passed 9,000MW for the first time this quarter, with 4,640MW/12,353MWh added over the past year alone. The connection pipeline has grown 42% in twelve months to 75.4GW, and batteries now make up more than half of it.
Look past the volume numbers, though, and AEMO’s own Q2 2026 Quarterly Energy Dynamics report tells a less comfortable story about what that growth is doing to returns.
NEM-wide battery price spreads, the gap between what batteries pay to charge and what they earn to discharge, fell from $342/MWh in Q2 2025 to $51/MWh in Q2 2026, an 85% decline in a single year.

Source: Australian Energy Market Operator, Quarterly Energy Dynamics Q2 2026 (July 2026), Section 2.4.1 “Batteries” and Section 2.2 “Wholesale electricity prices.”
Estimated net revenue for grid-scale batteries across the NEM fell from roughly $130.5 million to $57.5 million over the same period, and the composition of that decline matters as much as the headline number.

Source: Australian Energy Market Operator, Quarterly Energy Dynamics Q2 2026 (July 2026), Section 2.4.1 “Batteries” and Section 2.2 “Wholesale electricity prices.”
Why This Matters More Than the Pipeline Headlines
Battery economics depend almost entirely on spread. A BESS makes money by charging when prices are low and discharging when prices are high. The wider that gap, the better the project’s return. Financial models underpinning the last three years of BESS investment decisions, including many only now reaching financial close, were built on spread assumptions drawn from a more volatile 2023–2025 market.
AEMO’s data shows that market has moved everywhere, not just in one state. Spreads collapsed in every NEM region: New South Wales fell 90%, Victoria 88%, South Australia 80%, and Queensland 79%.
At the same time, energy charging costs for batteries rose 79%, from $29.8 million to $53.4 million, as more batteries competed to charge during the same cheap daytime window. This is a textbook case of an asset class becoming a victim of its own success. Batteries are now the single most influential technology in NEM price formation, setting prices in 36% of all dispatch intervals, more than double their influence a year ago, and 46% of evening peak intervals specifically.
The more capacity that piles in to exploit volatility, the more that same capacity flattens the volatility it depends on. AEMO’s data confirms the mechanism directly: rapid growth in battery participation flattened the intraday price profile precisely because batteries themselves were charging and discharging into it.

Source: Australian Energy Market Operator, Quarterly Energy Dynamics Q2 2026 (July 2026), Section 2.4.1 “Batteries” and Section 2.2 “Wholesale electricity prices.”
The Paradox for Boards Approving New Projects
Here’s the uncomfortable part. Approvals aren’t slowing down. AEMO and network service providers approved a record 6.9GW of new generation and storage connections this quarter, batteries alone accounting for 3.6GW of that. Government schemes continue to add supply on top through the Capacity Investment Scheme. That’s a reasonable policy response to a genuine reliability need as coal exits the system. But it also means more merchant capacity is entering a market where the price signal that justifies standalone battery investment is already compressing fast, and by AEMO’s own numbers, compressing faster than most models anticipated.
For a board approving a new standalone BESS project, or reassessing an existing one, the question isn’t whether storage is still needed. It obviously is; batteries displaced 1,441 MW of gas-fired generation during the evening peak this quarter alone. The question is whether the project in front of them is being underwritten on spread assumptions the market has already left behind.
What This Means Specifically for Organisations Considering a Battery as Part of an Energy Optimisation Play
This is where the distinction really matters, and where a lot of boards are currently getting their investment case wrong.
A growing number of large energy users, data centres, manufacturers, mining operations, commercial portfolios, are evaluating on-site or co-located batteries not as merchant generation assets but as part of a broader energy optimisation strategy: reducing peak demand charges, hedging retail exposure, improving resilience, and, often, being pitched a “revenue stack” where wholesale market participation and FCAS are presented as an additional return layer on top of the core operational saving.
That third layer is exactly the one AEMO’s data has just repriced. If your investment case includes a component built on capturing wholesale spread, whether directly or through a third-party optimisation provider, that number needs to be tested against $51/MWh, not the $342/MWh environment many of these proposals were originally modelled in. A payback period that looked like four years on 2024 assumptions may look meaningfully different once the wholesale leg of the stack is corrected to current market reality.
The good news for this category of buyer is that the strongest part of most optimisation business cases, network and demand charge avoidance, is largely insulated from this trend. Those savings come from your own load profile and your network tariff structure, not from NEM spot price volatility. That makes it more important, not less, for boards to ask their project sponsors or vendors to separate the business case into its components: what proportion of projected return depends on network charge avoidance and retail hedging (durable), versus wholesale arbitrage and FCAS participation (compressing, on AEMO’s own numbers). A proposal that blends these into a single blended payback figure is the one most likely to be overstating the case.
Three questions worth putting to management or a vendor before approving a battery investment framed around energy optimisation:
- What share of the modelled return sits in wholesale arbitrage or FCAS, and what spread assumption is it built on?
- Has that assumption been re-tested against the current $51/MWh NEM average, and the regional figure that actually applies to the site?
- If the wholesale component were removed entirely, does the network and demand charge case still justify the capital outlay on its own?
If the answer to that last question is yes, the investment case is genuinely robust. If the case only clears its hurdle rate once wholesale arbitrage is included at pre-2026 spread levels, the board is being asked to underwrite a return stream that AEMO’s own data says has already shrunk by 85%.
Where This Leaves the Investment Case
Australia’s storage build-out isn’t slowing down, and it shouldn’t. The system needs the firming capacity, and batteries are already doing real work displacing gas and coal at peak times. But AEMO’s own figures show the returns available to the assets funding that build-out are being reshaped in real time by the sheer scale of the rollout itself. Boards and investment committees, whether approving merchant generation assets or a behind-the-meter optimisation project, still treating spread capture as a stable, repeatable return stream are working from a market that, on AEMO’s numbers, no longer exists.
Worth asking directly: is your project’s business case still standing on the price environment it was modelled against, or has the ground already moved?
Interested to hear how others are seeing this play out in their own portfolios or project appraisals.
#BatteryStorage #EnergyTransition #RenewableEnergy #Australia #EnergyInvesting #BESS #CapitalMarkets #AEMO
Source: Australian Energy Market Operator, Quarterly Energy Dynamics Q2 2026 (July 2026), Section 2.4.1 “Batteries” and Section 2.2 “Wholesale electricity prices.” https://www.aemo.com.au/-/media/files/major-publications/qed/2026/qed-q2-2026.pdf. Charts derived from figures reported in that publication.
Leave a Reply